
I have encountered strange behavior when training GCN for a long period of time. My dataset of use is FUNSD. These are my loss and accuracy plots:
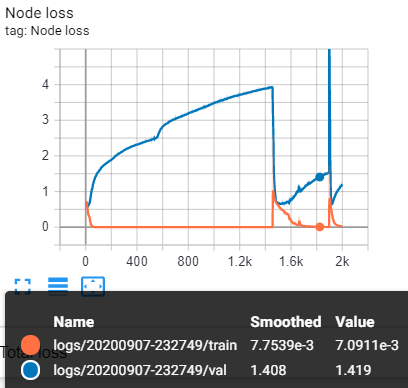
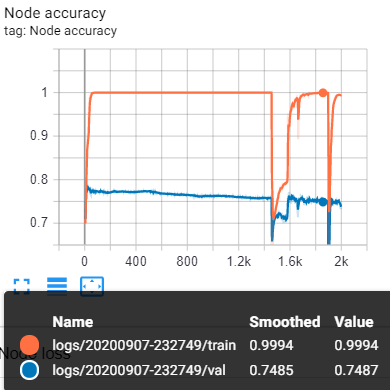
It happens when I use GCN, Chebnet or GraphSAGE NN module. Is there an explanation for such kind of phenomenon ?
It seems that your model overfitted very soon. Can you elaborate more about the way you performed modeling? This can include:
- More details about the dataset and the pre-processing. What is this dataset? How did you come up with the graphs for modeling? What are the node features and node labels? Do you expect your model to make correct predictions given the features you have?
- Have you modified the vanilla GCN model?
As what you observed, we have encountered the abnormal phenomenon when model overfitted.
Now, we are using FUNSD dataset (link: https://guillaumejaume.github.io/FUNSD/). Our objective is to assign text lines into 3 predefined classes (“QUESTION”, “ANSWER” and “OTHER”).
We consider each text line as a node. Besides, from bounding boxes text lines in documents provided by FUNSD, we convert each document into a graph based on spatial relation between bounding boxes. Additionally, we make use of text-line contents to represent node features.
Afterward, we build a simple model contains 4 GCN layers to implement classification task.
Indeed, we have assumed that convolutional filter type is a source cause of this phenomenon. So, we make some experiments with 3 different filter type (ChebConv, GraphConv and SAGEConv) but we have still encountered the abnormality.
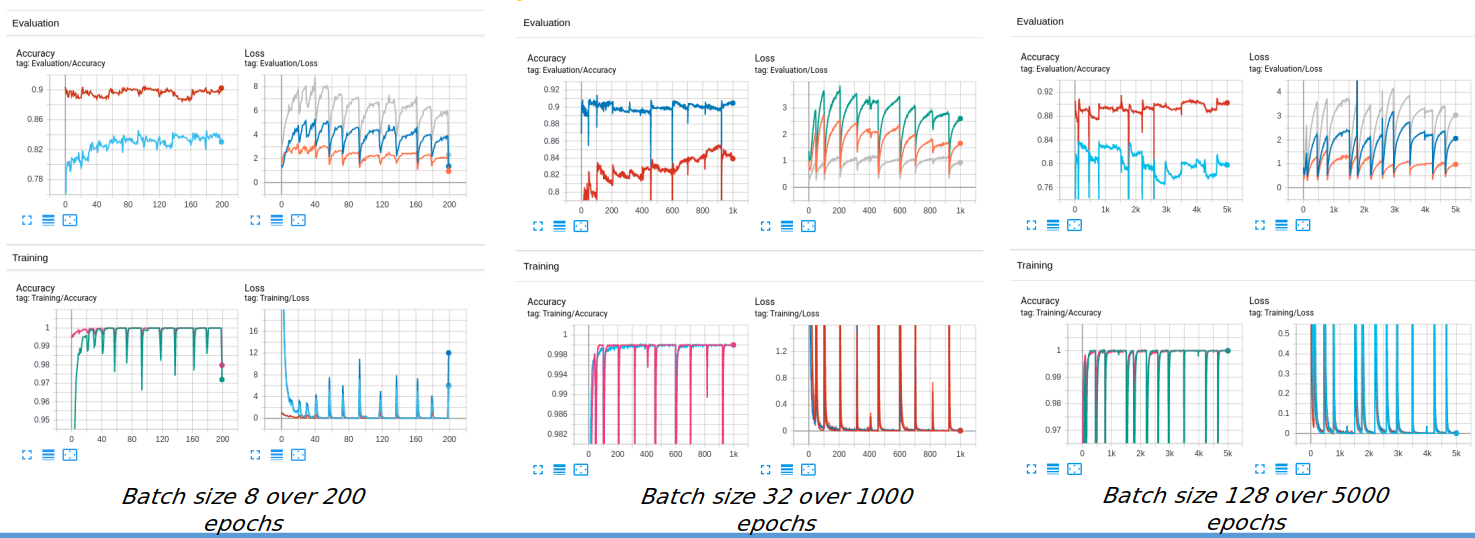
We observed that the phenomenon occurs repeatedly without specific period. However, if we decrease batch size in training, it would be easy to encountered this phenomenon (as the illustration below)
We are so confused and hope to receive an elaboration.
Many thanks!
1 Like
Hi there. How does the initial node features computed? Are they computed by a pre-trained LM or something?
1 Like
@HuXiangkun they are computed by multiligual cased BERT model. Then we learned a BiLSTM to reduce the number of features from 768 to 512
Maybe you can try to only use the BERT embedding first (without fine-tuning BERT, and without BiLSTM), and just check whether it’s the problem of GCN.

I downloaded the dataset and saw 149 graphs in the training set, though this is a node classification task, it’s pretty small. So the model can easily overfit the data. Can you try to make the model smaller to avoid overfitting?
2 Likes