R-GCN, homogeneous graph with different edge types

Hi,

I was thinking about the most efficient way of doing the following:
I want to apply R-GCN to a graph with homogeneous nodes - they have different features though - but with multiple types of edges. The type of edge is based on the features of the node. I currently make a homogeneous graph - with one edge type - with an adjacency matrix. Can I still somehow use this graph and simply add some other types of edges or do I need to use dgl.heterograph with data_dict input? Or is there still another efficient method? :slight_smile:

Kind regards,

Erik

1 Like

Can I still somehow use this graph and simply add some other types of edges or do I need to use dgl.heterograph with data_dict input? Or is there still another efficient method?

To create a graph of multiple edge types, you need to use dgl.heterograph. Alternatively, you can store edge types as an edge feature.

Thank you for the quick reply! Does the alternative - storing edge type as edge feature - still allow me to work with R-GCN in a similar fashion as with a dgl.heterograph?

Yes. See this example.

Thanks again for the quick reply, helps a lot! I think I will just use the dgl.heterograph now.

One final question: for R-GCN self-loops do not have to be added to the graph as this is already included in the computations right?


Judging from this formula, adding self-loops myself would result in taking a nodes ‘own message’ into account twice. Thank you!

I think you are right.

1 Like

Hi Mufeili,
apologies for getting back so late on this! I still had one question regarding R-GCN. I made heterographs now, but I actually do not really get why they had to be heterographs to be able to use the r-gcn module for Pytorch as provided in DGL? For the forward function I need to provide the following:

My node types are all the same, it’s just that I have 3 different relations between them. Is there still any reason to use the heterograph if I need to provide the edge types (etypes) in the forward function anyway? Or is there a way I can rewrite the forward function to take a heterograph as input without still having to provide the edge types? Sorry for asking for a maybe obvious question, but so far I did not manage to find how this now actually works with a heterograph!
Kind regards,
Erik

Hi Erik,

Current DGL has two ways to represent a heterogeneous graph.

  1. Use a homogeneous graph (from dgl.graph) that carries the type information as node and edge data.
  2. Use a heterogeneous graph (from dgl.heterograph) that encodes the type information natively in the graph object (i.e., g.ntypes, g.etypes, etc.)

The RelGraphConv module is for the first kind, so you can see the etypes argument accepts a tensor of shape (|E|,) (the other case is to further optimize it by sorting the edges by their types).

There is no off-the-shelf NN module for the second kind, but we do have an example showing how to define a module that accepts a heterograph object.

I agree this is somewhat confusing and the reason is more for system efficiency concern. We do recommend you to continue using the heterograph approach as we believe it is the right way of modeling. In the future, we will also gradually fold the first kind into the second one and provide a single and uniform interface.

1 Like

Hi Minjie,

thank you for your reply and the further explanation! I am currently working with the example you provided and that seems to work!

I have one more question, which is slightly related, so maybe you can help me. I think I need to shortly introduce my setup for this to make sense (apologies for the long question):

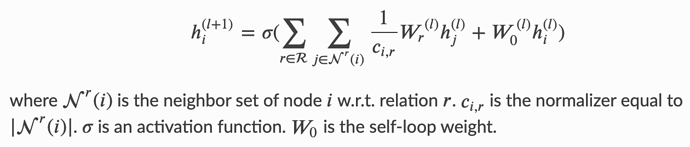
I am using DGL for reinforcement learning on a grid world environment. Each observation is a description of the entire grid, which tells the agent what is present at each grid cell. These observations are encoded as a graph, which will hopefully enable me to add some relational reasoning between elements in the observation. I would like to work with R-GCN and the observations are encoded into a graph as follows:

  • Each grid cell is a node in the graph
  • There is a ’next to’ relation/edge between all adjacent grid cells, these edges are always the same for each observation as the actual size of the grid does not change
  • There are two more types of edges which indicate specific relations between certain items in the grid world. In my case these are edges between keys and the corresponding doors they open and edges between the agent and these keys. As the positions of these objects change, these edges will also have to change for each observation.

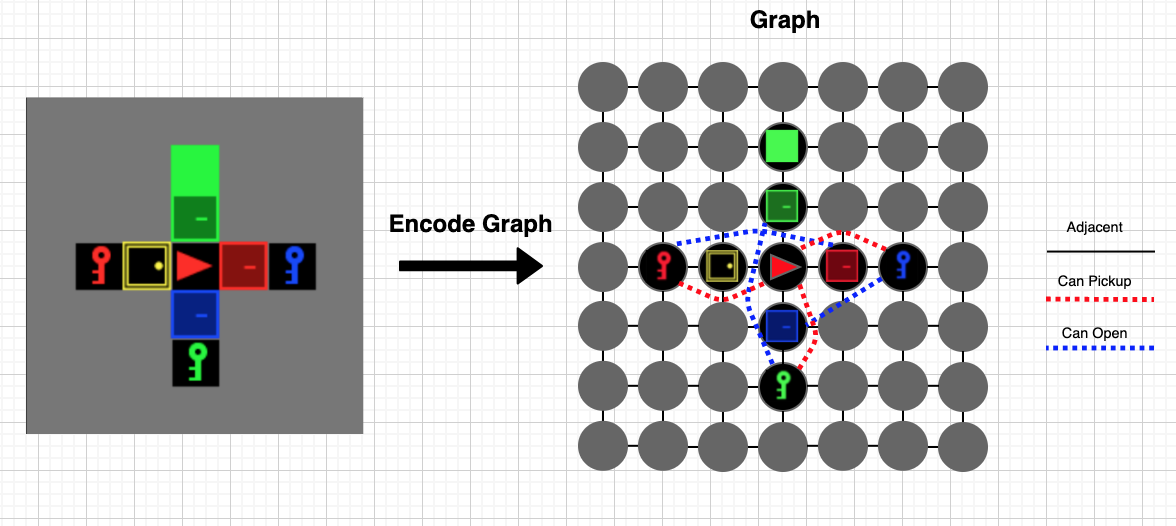
A rough sketch of this idea:

The question:

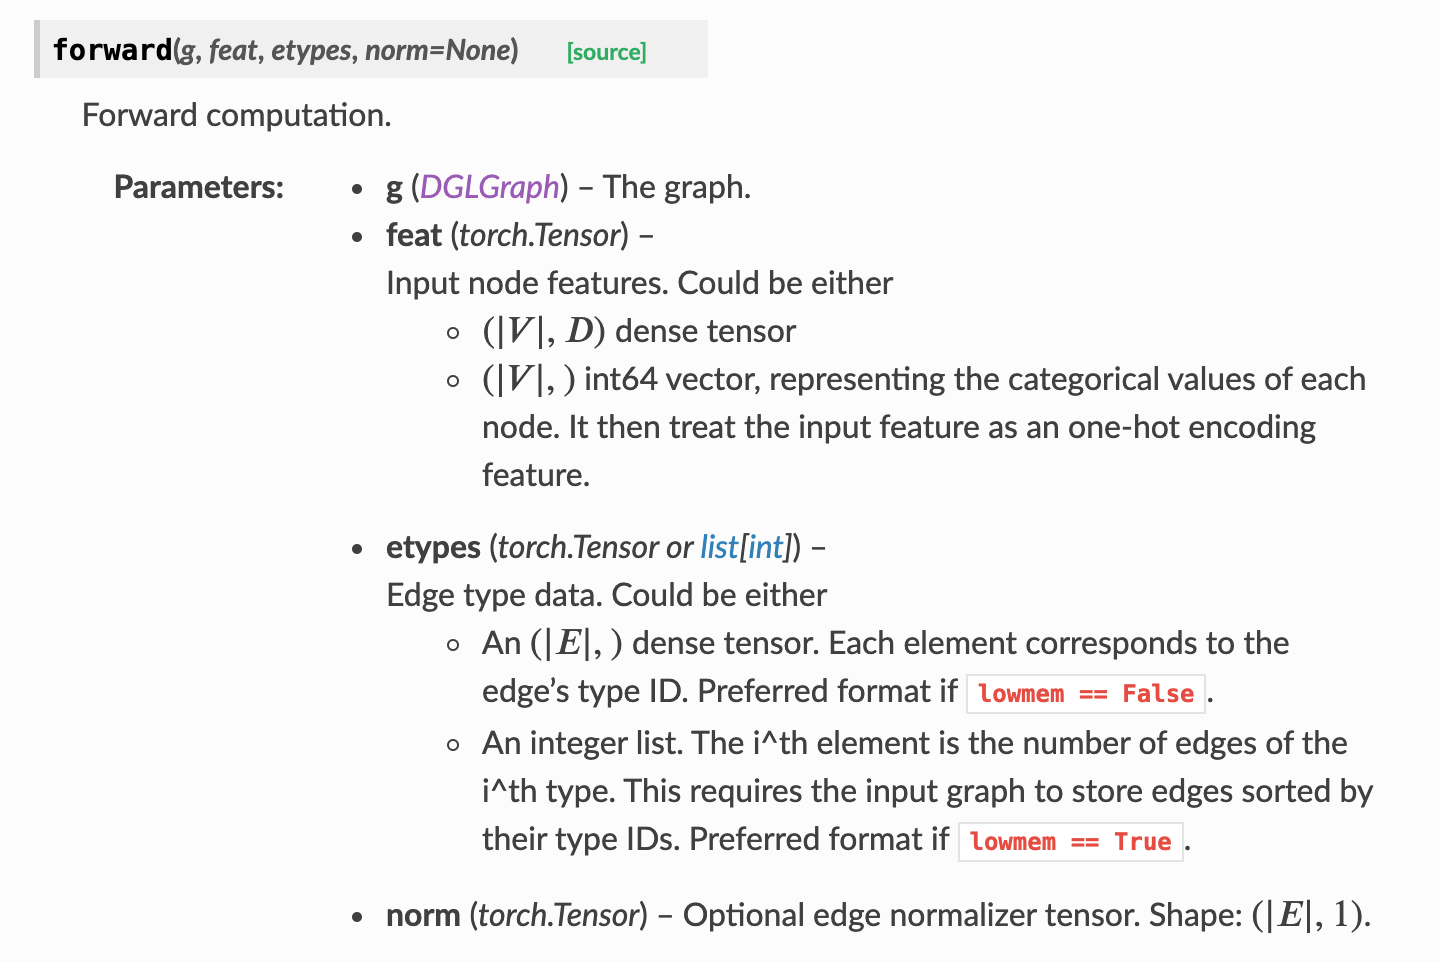
Is there an efficient way to create these graphs and preferably even an efficient way to create a batch of these graphs? Currently I am sending a mini batch of observations - which are edgelists for each relation as I cannot actually store graphs as observations due to the observations spaces of Gym - to my forward pass. In the forward pass I make all the the graphs from these observations and then batch them, but this is very slow.

One option I was thinking of was to actually do use the homogeneous graphs and then I could add/remove the two types of relational edges - ‘Can Pickup’ and ‘Can Open’ - which change per observation? Another option could maybe be to make a fully connected graph for the 2 relations that change per observation and then adapt the weights of these edges to select some of them based on the observation?

If you have an idea on how to do this more efficient, it would be highly appreciated!!

Kind regards,

Erik

Hi Erik,

Thanks for sharing your project and sorry for the late reply. It is very interesting! I would like to know more about the scale of your problems.

  1. What is the typical size of each observation graph (i.e., grid size)?
  2. What is the typical number of edges for ‘Can Pickup’ and ‘Can Open’?
  3. Are these edges always pointing horizontally or vertically?
  4. What is the typical batch size you are using?
  5. You said that graph creation is the bottleneck. Have you quantified that?

Minjie

Hi Minjie,

Thank you for your reply and for looking into this!
My answers to your questions:

  1. What is the typical size of each observation graph (i.e., grid size)?

Usually small: around 7x7 or 10x10

  1. What is the typical number of edges for ‘Can Pickup’ and ‘Can Open’?

This is around 4 to 8 edges for each.

  1. Are these edges always pointing horizontally or vertically?

No, this depends on the location of the objects.

  1. What is the typical batch size you are using?

I am using minibatches with around 500/1200 samples in them. So that would also be 500/1200 graphs which will be batched together.

  1. You said that graph creation is the bottleneck. Have you quantified that?

For normal GCN, I have made a version where I precompute the batched graphs and just load the features onto them - I can do this as here each observation has the same topology; just the ‘next to’ relation - and this is approximately 2x as fast as creating the graphs per observation and batching them. However, this is a fair question as I sort of assumed it to be a bigger difference and for R-GCN I will have to still batch the graphs per minibatch as they will contain different ‘types’ of graphs (the relational edges being different for each observation). However, any speed increase would help me!

If you still have some ideas, I would be very happy to hear them!

Kind regards,
Erik

I’m thinking of reducing the size of the graph by only recording the delta since the grid environment does not change a lot over time. Another idea is to represent your state as a clique graph whose nodes are only objects of interests (e.g., the key, door, agent, etc.). Through time, the graph remains fully-connected but the node features (e.g., positions) are changing due to actions. In this modeling, you could pre-batch graphs together and reuse them everytime.

image

oui je pense c est la bonne repens

snaptube vidmate

Hi Minjie,

my apologies for the late reply! Thank you for really looking into this and thinking along with me! The more sparse representation where nodes are only the objects of interest is something I will look into as well. However, I think that one downside might be that you would loose the structural/positional inductive bias that was encoded in the structure of graph.
I found a solution for now, which actually worked well for my case where there aren’t that many different possibilities for the ‘can pickup’ and ‘can open’ relational edges. I have created a hashmap where I store the different possible graph-structures. If I have seen a graph before I load it from the hashmap and just load on the new features, otherwise I create the graph and add it to the hashmap. This makes it quite a lot faster now.

Thank you again, really appreciate you taking the time to help me!

Kind regards,
Erik

This topic was automatically closed 30 days after the last reply. New replies are no longer allowed.