Hey everyone,
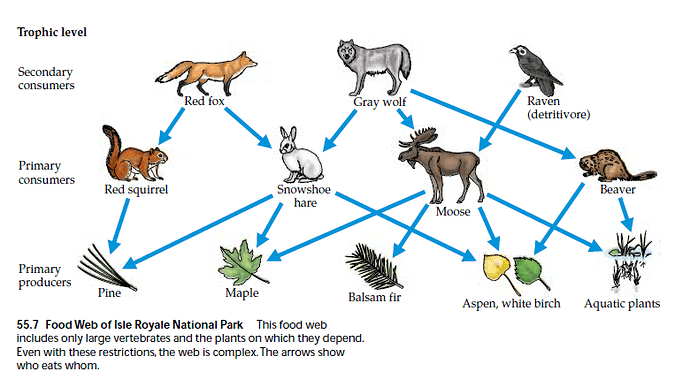
I would like to introduce you to a new data set of primary school science diagrams that I created with my collaborators. The data set is named AI2D-RST, which is based on the Allen Institute for Artificial Intelligence Diagrams data set, or AI2D for short. To give you an example, the diagrams are like this:
AI2D-RST contains three annotation layers, which are all represented as graphs: (1) A grouping graph representing perceptual groupings of diagrams elements, that is, elements that are likely to be perceived as belonging together, (2) connections between elements or their groups that are signalled using arrows and lines and (3) semantic relations that hold between diagram elements and their groups, as defined using Rhetorical Structure Theory, an established theory of text organisation.
The data set is introduced in greater detail here: https://github.com/thiippal/AI2D-RST
You can also find convenience functions for loading the data from JSON files, and a PyTorch dataloader to be used with DGL.
Let me know if you have any questions! I would love to see someone take on problems like generating a graph given a set of nodes. The AI2D-RST only covers 1000 out of 4900 diagrams in the original AI2D dataset, so annotating the rest automatically would be awesome.

