Memory Accumulation in own R-GCN forward function

Hi everyone,

My Model is a multi-modal Link prediction graph and after upgrading from from dgl==0.9.1 to 2.1.0 I face memory accumulation of around 100 mb every iteration step.

Taken from here: Minimal MultiGML Files · GitHub
The OOM always happens in the lines below

    def forward(self, g, inputs):
        hs = self.conv(g, inputs, mod_kwargs=wdict)
        
        output = {ntype : self._apply_conv(ntype, h, inputs_dst) for ntype, h in hs.items()}
        del g, inputs, weight, hs 
        
        # print("relgraph final vram usage ", (th.cuda.memory_allocated() - _rel_initial_vram ) / (1024 * 1024), "MB")
        return output

    def _apply_conv(self, ntype, h, inputs_dst):
        if self.self_loop:
            h = h + th.matmul(inputs_dst[ntype], self.loop_weight)
        if self.bias:
                h = h + self.h_bias
        if self.activation:
            h = self.activation(h)
        return self.dropout(h)

While self.conv is

        self.conv = HeteroGraphConv({
                rel : GraphConv(in_feats=self.in_feat, out_feats=self.out_feat, norm='right', weight=True, bias=False)
                for src, rel, dst in rel_names
            })

My current workaround is to either use h.detach() in apply conv or set the batch_size to only one step per epoch. As this is not the intended way of using it, I wanted to ask if any of you have a better idea to solve this problem.
Thanks in advance :slight_smile:

The provided code is pretty long so I wonder if the problem is caused by this particular module or something else in the program. Could you try just feeding some synthetic data into this module, run it a couple of times to see if memory leakage still exists? This will help us locate the problem.

It is difficult due to the complexity to add synthetic data, I created a subset using a cluster algorithm which contains about 248 Nodes, 573 Edges (1% of the original), and 8 relation types.

The accumulation still occurs constantly at about 1 MB per step, every run. No reduction of usage after completed epoch. My suggestion is some issues with the data-loader and garbage collection.
Clearing the redundant edges helped as well, if this could be useful.

If you think synthetic data is better I will try to create it.

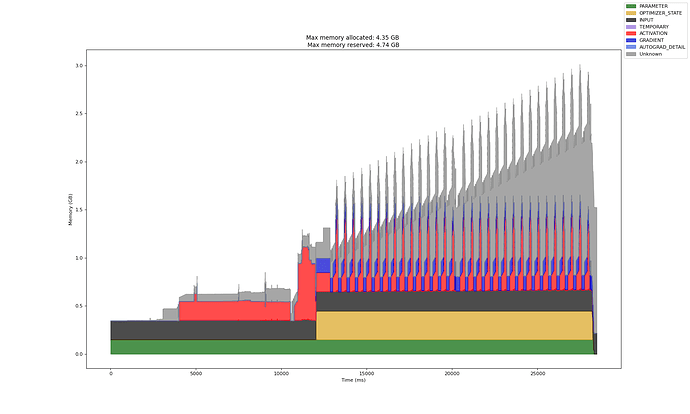
Here is an image of the detailed VRAM usage.
Is it safe to assume that the training and calculation is not the reason of this error rather than a not freed variable due to the large unknown area?
It also increases with the number of hidden layers.

This topic was automatically closed 30 days after the last reply. New replies are no longer allowed.