Graph construction from a feature dataframe

Hi,

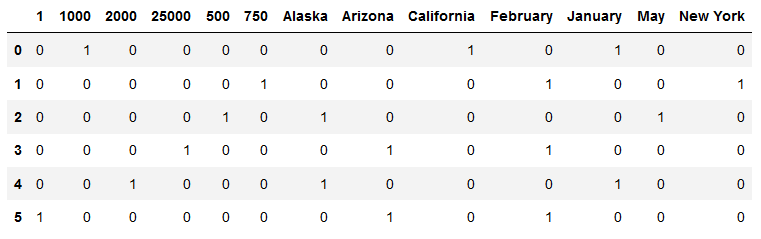
I’m looking for an efficient way to construct a graph from a dataframe of multi-label binarized features. The objective is to obtain a graph in which all the nodes that share the same features are connected. For example, in the df below, there would be edges betweeen the nodes 1, 3 and 5, because they all have the feature ‘February’.

I was thinking of something like iterating through feature names, creating permutation grids of all the nodes that mention them and then concatenating the grids into the final arrays of source and destination nodes. Is there be a better way to do it?

do you need to distinguish the edge type(node A and node B may be connected due to same February and same Alaska)?

Does it mean that two nodes can be connected with multiple edges of different types? I just sort of assumed that if a node pair is mentioned more than once in dgl.graph(), they would end up with only one edge anyway. But if that’s not the case, it would be great to distinguish multiple edge types between them. Unless there are some potential issues with that?
However, if multiple edges between the same two nodes are not possible, then there is no need to distinguish their type.

>>> g=dgl.heterograph({('a', 'e', 'b'):([1,2,3], [2,3,4]), ('a', 'ee', 'b'):([1,2,3], [2,3,4])})
>>> g
Graph(num_nodes={'a': 4, 'b': 5},
      num_edges={('a', 'e', 'b'): 3, ('a', 'ee', 'b'): 3},
      metagraph=[('a', 'b', 'e'), ('a', 'b', 'ee')])

Great, thanks for pointing me towards heterographs. In this case, I guess that my initial idea for a graph constructor will work but I’m still not sure if it will be the most efficient. Especially that I have 1000 nodes (all of the same type) and around 200 features (=types of edges).

what’s the time complexity of graph generation for each feature? num_nodes=1000 looks not big…

There are many ways to create a graph from a table, and there is no best way to do so. In your case, I think your rows are individual instances and the columns are a concatenation of different categories. The graph is already in the form of an adjacency matrix, so you could probably convert it into a scipy sparse matrix with scipy.sparse.coo_matrix (or csr_matrix or csc_matrix; doesn’t matter). Then you can create a bipartite graph with

adj = scipy.sparse.coo_matrix(df.values)
g = dgl.heterograph({
    ('data', 'edge', 'category'): (coo.row, coo.col),
    ('category', 'rev_edge', 'data'): (coo.col, coo.row)   # reverse edges
    })