Different node types are apart in embedding space

Hi, I’m working on a recommendation problem on a heterograph with multiple node types. It’s roughly about users clicking on items. There are other interactions as well, but for simplicity I now focus on a simplified version. The approach is as follows.

  • Define the graph with (‘user’, ‘click’, ‘item’) and (‘item’, ‘rev-click’, ‘user’) edge types
  • Train a model
    • optional linear input embed layer for users and items
    • 3 layers of HeteroGraphConv wrapper around SAGEConv blocks, followed by ReLU and normalization
    • Dotproductpredictor (for both positive and negative edges)
    • max margin loss on the positive and negative scores
  • Use cosine similarity search on users to get the most similar items

This kind of works (the model is learning), but I keep running into the same problem:

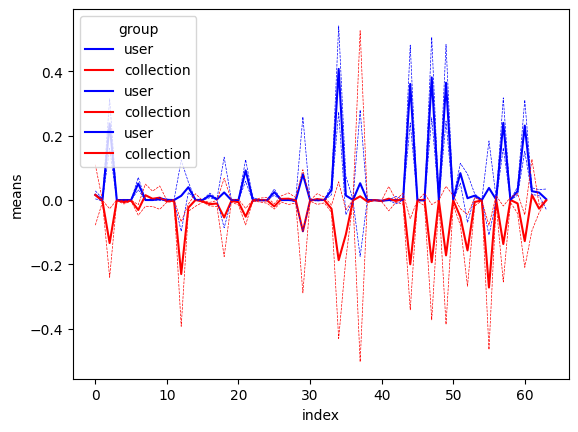
  1. Embeddings of users are separated from embeddings of items: they are clearly apart in embedding space, and as a result the similarity search produces sort of random results. Within the items space, I see that similar items are indeed close in space, but the users are just somewhere completely different. Between users and items, the means and standard deviations of each embedding feature are different.
    See below image (mean +/- stddev for each of the 64 embedding features for users and collections (items))
    download

I’ve experimented with different options for normalization: with, without, batch normalization, in all layers except the last; use an extra input embedding layer before applying SAGEConv blocks… but all have the same result. Does this have to do with asymmetry in degree (users typically have 1 - 5 clicks, items have thousands)? What can be done about it?

  1. A second issue is that the loss during training is always of a different order per edge type: theloss for the reverse etypes always have a higher loss. What could be the cause of this?

Hope I’ve explained it well. I would be grateful for any tips.
Thanks, Robert

For the first issue, if I understand it correctly, the figure shows aggregated results on all users and items. Thus, the discrepancy can be caused by users and items that have no connections. Have you contrasted the cosine similarity between a user-item(clicked) pair and a user-item(random) pair?

For the second issue, what’s the total number of item nodes and user nodes in training?

Hi dyru, thanks for your reply.

Ad 1: Yes they are indeed aggregated results over all users/items. But also if I look at individual pairs of user-item clicks, the user is positioned (in embedding space) close to all other users, and the item close to all other items. They are simply two different clusters. As a result, the cosine similarity between a user and all items is kind of random (not significantly higher for click pairs than for non-click pairs), because it seems to be in a completely different space.

Ad 2: There is indeed an inbalance there: I have 17 million users and 20,000 items in the graph (60 million clicks). Are you suggesting there are more (user, clicks, item) data points than there are (item, reverse-click, user) data points? Aren’t they the same?

For the first part, could the reason be the difference between “dot product” in training and “cosine similarity” during inference?

For the second part, indeed the numbers of two kinds of links are the same. My point is that the total numbers of negative examples (items/users) to be contrasted are quite different. I’m not sure but the loss discrepancy might be related to that.

Hi dyru,

could the reason be the difference between “dot product” in training and “cosine similarity” during inference?

I thought about that as well. I tried normalizing the vectors before doing the dot product (so effectively doing cosine similarity in training as well), but it didn’t really make a difference.

My point is that the total numbers of negative examples (items/users) to be contrasted are quite different. I’m not sure but the loss discrepancy might be related to that.

I think it has to do with a difference in degree distribution: most users click on between 1 and 4 items, while items are clicked in by many users. So they have a different neighborhood size.

I’ve had a breakthrough recently by replacing the SAGEConv encoders by GATv2Conv encoders: the cosine similarities now make sense. It was a big boost in performance! I guess the ability to attend to neighbors differently is very important in my case.

This topic was automatically closed 30 days after the last reply. New replies are no longer allowed.