DGL graph classification

I would like to dgl graph so learnig for Grpah Convolutional Network model.
but I think I don’t know how to make make dgl graph.

I would like to question how to make dgl graph? like a exactly nodes featears and edges fearears.
I’m going to learing exactly nodes featears and edges fearears.

below example my sensor data
sensor0,sensor1,sensor2,sensor3,sensor4,label
59.6,24.7,274,2251,6333,2
44.8,21.6,212,2408,8585,2
43.6,21.4,98,12,416,0

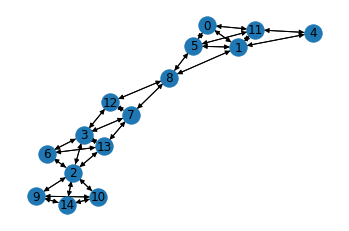
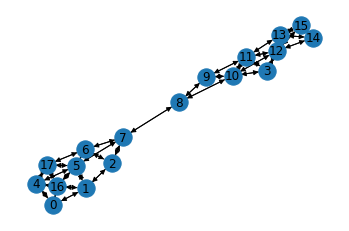
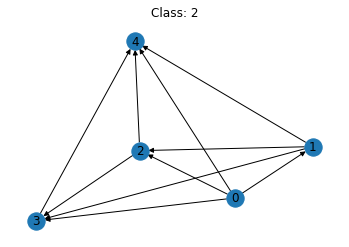
and I drawed and learning graph like below
#graph [
Graph(num_nodes=5, num_edges=20,
ndata_schemes={‘x’: Scheme(shape=(), dtype=torch.float64)}
edata_schemes={}),
Graph(num_nodes=5, num_edges=20,
ndata_schemes={‘x’: Scheme(shape=(), dtype=torch.float64)}
edata_schemes={}),
Graph(num_nodes=5, num_edges=20,
ndata_schemes={‘x’: Scheme(shape=(), dtype=torch.float64)}
edata_schemes={}),
Graph(num_nodes=5, num_edges=20,
ndata_schemes={‘x’: Scheme(shape=(), dtype=torch.float64)}
edata_schemes={})]
#label [2, 0, 2, 0]

print(graph[0].ndata[‘x’] )
tensor([ 59.6000, 24.9000, 363.0000, 8849.0000, 22325.0000],
dtype=torch.float64)

image
image

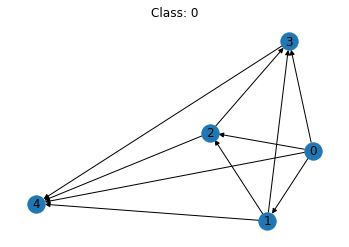
My goal is graph classification

How to draw graph of my sensor data and make GCN model and learning?

Thank you for your insteresting.

It seems that all your graphs have the same number of nodes and edges. Do they have the same graph structure? Have you read this on graph classification? Training a GNN for Graph Classification — DGL 1.1.1 documentation

1 Like

I tried it like below(above link).

import matplotlib.pyplot as plt
import networkx as nx

fig, ax = plt.subplots()
nx.draw(graphs[0].to_networkx(), ax=ax, with_labels=True)
image
nx.draw(graphs[1]…
image
nx.draw(graphs[2]…
image

but my data is like below.
sensor0,sensor1,sensor2,sensor3,sensor4,label
59.6,24.7,274,2251,6333,2
44.8,21.6,212,2408,8585,2
43.6,21.4,98,12,416,0

What do you think about how to draw feature of nodes and feature of edges my data with dgl graph?
I think there are 5 nodes in my data at one row.
and one row is a graph.

And then how to learning use GCN model?
please help me!!

Is sensor0 to sensor4 respectively the feature of each node? What are their semantic meanings?

1 Like

@mufeili They are humidity, temperature, MQ139, TVOC, eCO2 sensors.
And they are fire occupied or not fire occupied dataset. In case fire happened are some causes of three fire situation.

It sounds like these are just different features. I’m not sure if you really need a graph to model them. Maybe it suffices to treat them as tabular data.

1 Like

Um … I have question.
How to check self node edge (identity matrix , unit matrix)?
in dgl graph

and How to check relation of node and edge ? in dgl graph

I think GCN is suffices to know situation.

This topic was automatically closed 30 days after the last reply. New replies are no longer allowed.