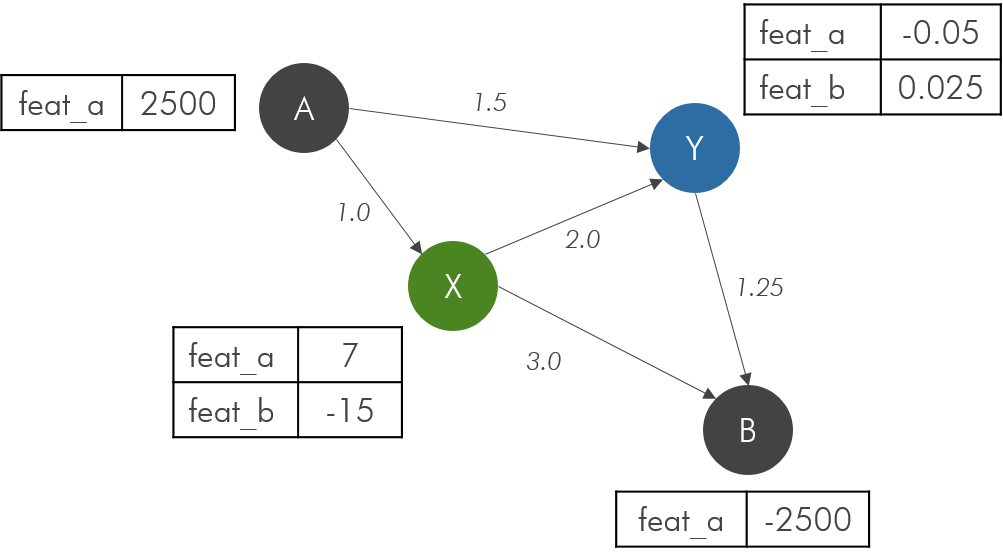
I’m hoping someone could help me with building a graph in DGL. Here is a small example of a heterogeneous, directed, weighted graph. The edges are all of the same type. In this example there are 3 different node types (denoted by color) and each with a unique label. Each node type has a different feature set. What I’d really like is to know what the corresponding .csv files would look like (presumably I would have one for each node type and for the edges) and how to load and build the graph in DGL. I’ve been looking at the “Tutorial for loading Karate Club Network from edge pairs CSV” and also the “Creating a Heterogeneous Graph” documentation, but I’m not able to put it all together for my simple example. (Note, the reason I want to understand how to do this with CSV files is that ultimately this graph would have hundreds of nodes and edges – not just the handful in this simple example). Thanks for any help!
You can treat the edges from one type to another as of a type. If you have 3 different node types, then you can have at maximum 6 edge types. You can then create one CSV file per edge type as described in Loading Heterographs from Disk.
@mufeili, thanks for getting back to me. Yes, now I understand that I need to provide a separate .csv file for each pair of node types. How to actually implement this is still unclear to me.
The DGL documentation provides an example for how to explicitly define a homogenous graph: Graphs, Nodes, and Edges, it also provides an example for a heterogenous graph Creating a Heterogenous Graph. While the “Tutorial for loading Karate Club Network from edge pairs CSV” provides an example of what .csv files look like for a homogeneous graph.
My question is what the .csv files need to look like for the hetereogenous graph (i.e. for the disease-drug-gene graph in Section 1.5 of the documentation) and how you read it into a DGL heterograph(). Having this information would not only answer my question, but the documentation would be more complete as well. I’d appreciate any help you can provide!
The CSV files for heterogeneous graphs are the same as those for homogeneous graphs except that you need multiple CSV files for a heterogeneous graph, one per edge type, while you only need one CSV file for a homogeneous graph.
Let’s say we want a CSV file for a drug-gene graph. Then you can do something as follows.
import csv
import dgl
import torch

# Save a CSV file for a drug-gene graph
num_nodes = 20
num_edges = 100
# source and destination node IDs
edges = torch.randint(high=num_nodes, size=(num_edges, 2)).tolist()

with open('drug_gene.csv', 'w') as f:
    writer = csv.writer(f, delimiter=',', quotechar='"')
    for i in range(num_edges):
        writer.writerow([edges[i][0], edges[i][1]])

# Load a CSV file for a drug-gene graph
src = []
dst = []
with open('drug_gene.csv', 'r') as f:
    reader = csv.reader(f, delimiter=',')
    for line in reader:
        src.append(int(line[0]))
        dst.append(int(line[1]))
g = dgl.heterograph({('drug', 'interacts', 'gene'): (torch.tensor(src), torch.tensor(dst))})
@mufeili, sorry one additional question. I have the simple graph below and I’ve shown the contents of each .csv file that describes the edges between node types. The format is: “(source, destination), weight”.

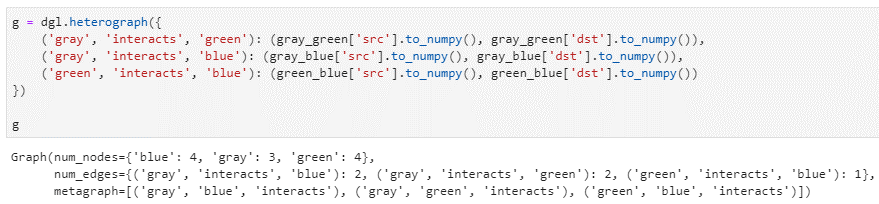
When I create a heterograph in DGL, it reports the total number of nodes as 11 rather than 5 (the number of edges is correct).
There must be something that I am not understanding correctly. As always, I appreciate any suggestions. Thanks.
You have 4 blue nodes, 3 gray nodes and 4 green nodes, which gives you 11 nodes in total. Nodes of different types are different.
@mufeili, clearly I’m missing something. As the image shows, I have 2 gray nodes, 1 green node and 1 blue node (i.e. 4 total, not 11). I included what I think the .csv files contain, but it’s obviously incorrect. Going back to my initial question, what would the .csv files need to look like to describe the graph as pictured? I assumed I needed one file to describe the 2 gray-green connections, one file to describe the 2 gray-blue connections and one file for the green-blue connection.
The point is that nodes of different types have separate IDs. If the largest ID for green nodes is 3, then it means you have 4 green nodes, etc.
@mufeili, thank you (again!). Yes, I realized this fact just moments before you posted your answer. What helped me was seeing this figure in the documentation:
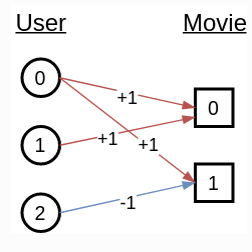
For what it’s worth, I would highly recommend a similar figure be included in the 1.5 Heterogeneous Graphs — DGL 0.5.3 documentation for the drug-disease-gene graph. It would clear a lot of issues up.
Thanks again for your help.
This topic was automatically closed 30 days after the last reply. New replies are no longer allowed.