Data normalization on GNN

Hi everyone. I would like to make sure of a simple thing.

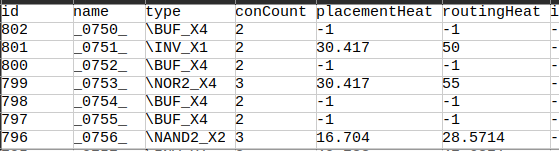
I have a dataset with multiple graphs, each of them looks like the following ( for the nodes file):
image

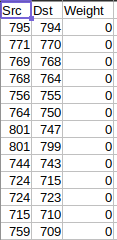
And an edges file like the following:
image

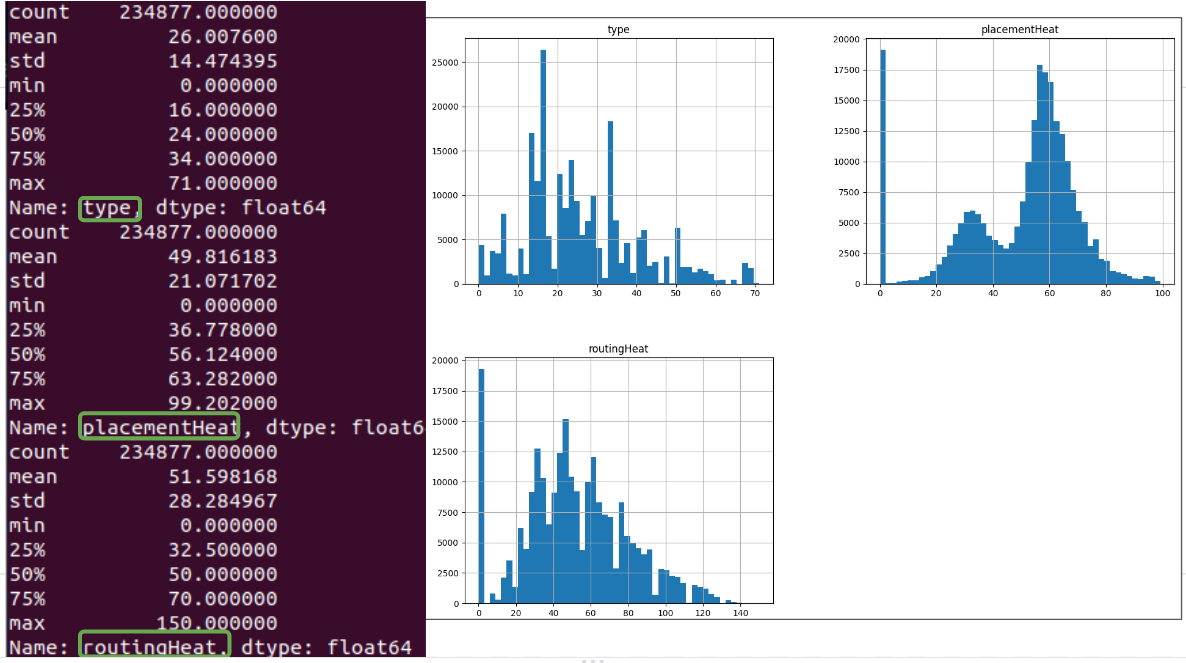
And some histograms for feature named type and the two labels:

I will not use the name neither the id for training. Notice I have a categorical feature named ‘type’, when I apply an encoding to this column, it should take into account all the graphs right? For example ‘\INV_X1’ should be mapped to the same value in all other CSVs right?

Also, I would like to remove the rows with -1 and 0 values in the labels ( ‘placementHeat’ and ‘routingHeat’ ), but I don’t know how to proceed since this will produce missing ID nodes in the edges CSV… For this, I think I should try to apply a normalization to the labels since they have too many outliers with -1 and 0 values. This normalization should be applied in the same way with all the graphs in the dataset, correct?

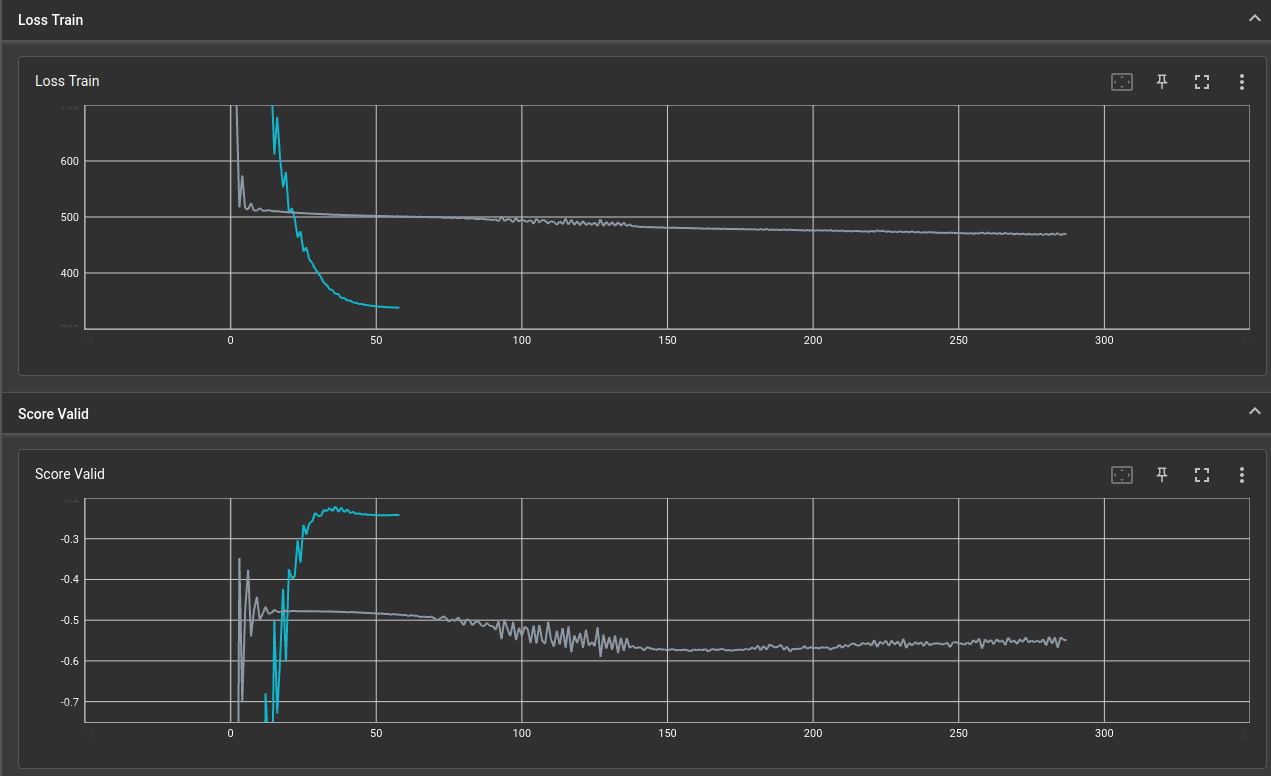
So far my implementation is reducing its loss value during training but its not really learning anything on its score.

Hi @gudeh . If I understand correctly, you want to remove the contributions of some nodes with -1 or 0 values on some features during the GNN training process. In this case, you can simply create a mask to remove those nodes before computing the loss function, which is similar to the training mask in GNNs training.

1 Like

Nice to know! This should be easier than removing nodes from the graph.

Let me try to explain why I don’t want this values:
This graphs come from the fabrication of logic circuits. This process has a lot of steps. The graph representing the circuit is changed along the steps. I am retrieving the features from an initial step and the labels from a final step. As you can imagine, the idea is to predict heat values concerning congestion of logic gates in the fabrication early in the process.

The issue is that some logic gates are removed from the graph on later steps, for this reason I have values of -1, such nodes don’t exist anymore on final steps of the process, although they did exist when features where defined ( there also new nodes on the graph in the final step, which I just ignore for now ). I am not entierly sure how to proceed with this nodes which are removed.

Your tip seemed to have improved quite a bit! Blue is after masking out the “-1”, grey was before that. Loss Train is torch MSELoss and Score Valid is sklearn R2 Score.

Still the model isn’t actually learning well enough!

If any kind soul could help me pointing out how to improve the learning, I would be extremely grateful!!

Your application is interesting. Very glad to see it works.

1 Like

By looking at the histogram with the two labels shouldn’t we be able to determine a possible normalization on the data? We should do so because of the outliers, correct?

I used standard normalization (z value) on one of the labels and got further “improvement”. Loss went from ~400 to ~0.8, and R2 score went from ~0.25 negative to ~0.05 negative.

1 Like

Yes. Data normalization is commonly used in many DNN applications.

This topic was automatically closed 30 days after the last reply. New replies are no longer allowed.