About distributed training of GraphSAGE

Hello everyone.
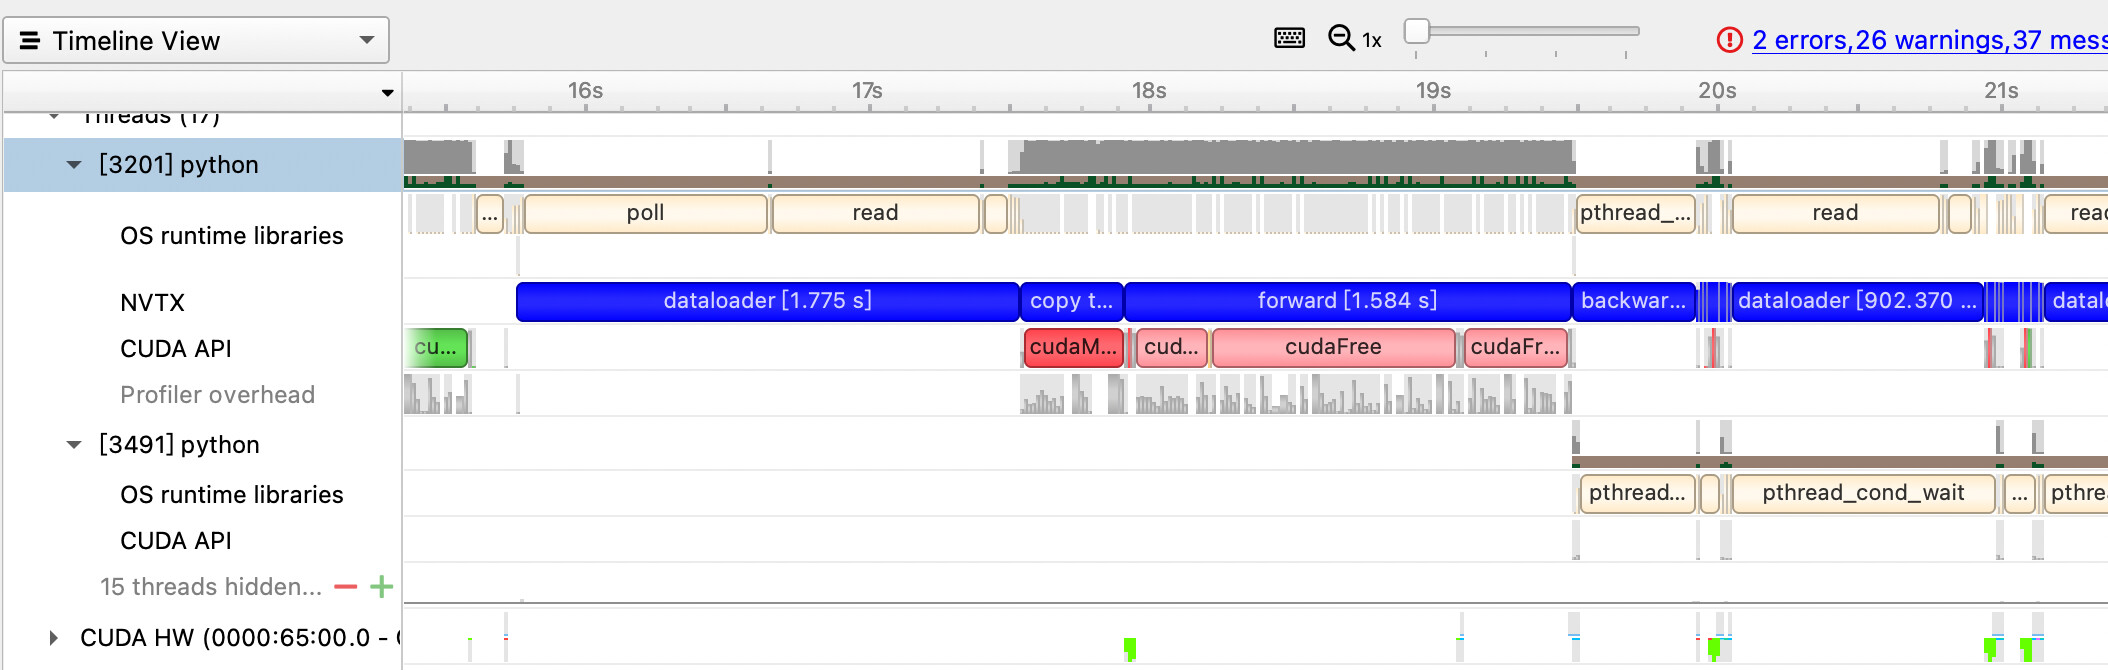
I am trying to follow the distributed training using DGL here: dgl/examples/pytorch/graphsage at master · dmlc/dgl · GitHub. And I use pytorch profiler to monitor the activity of CPU and GPU.
It looks like that:


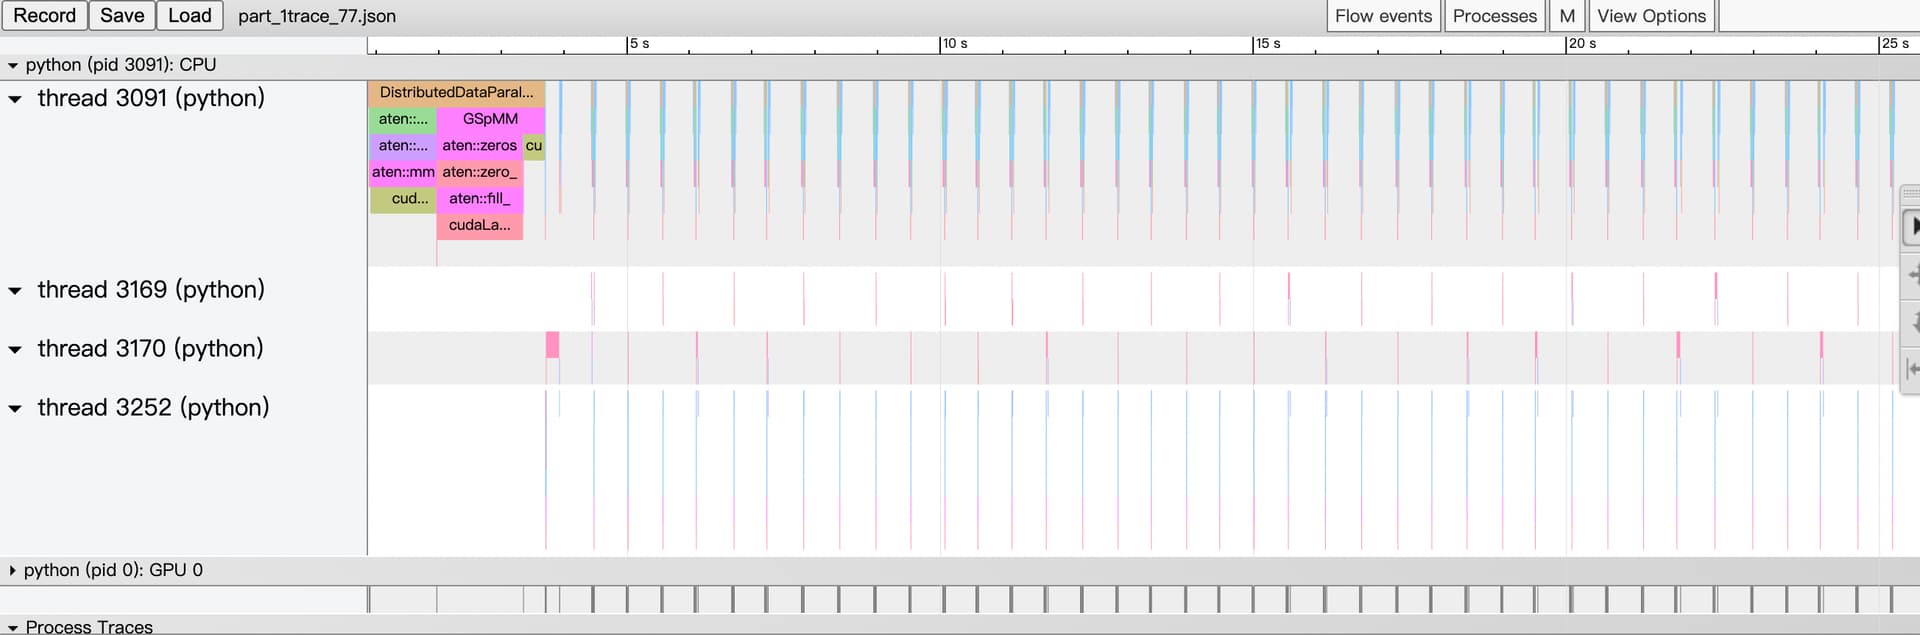
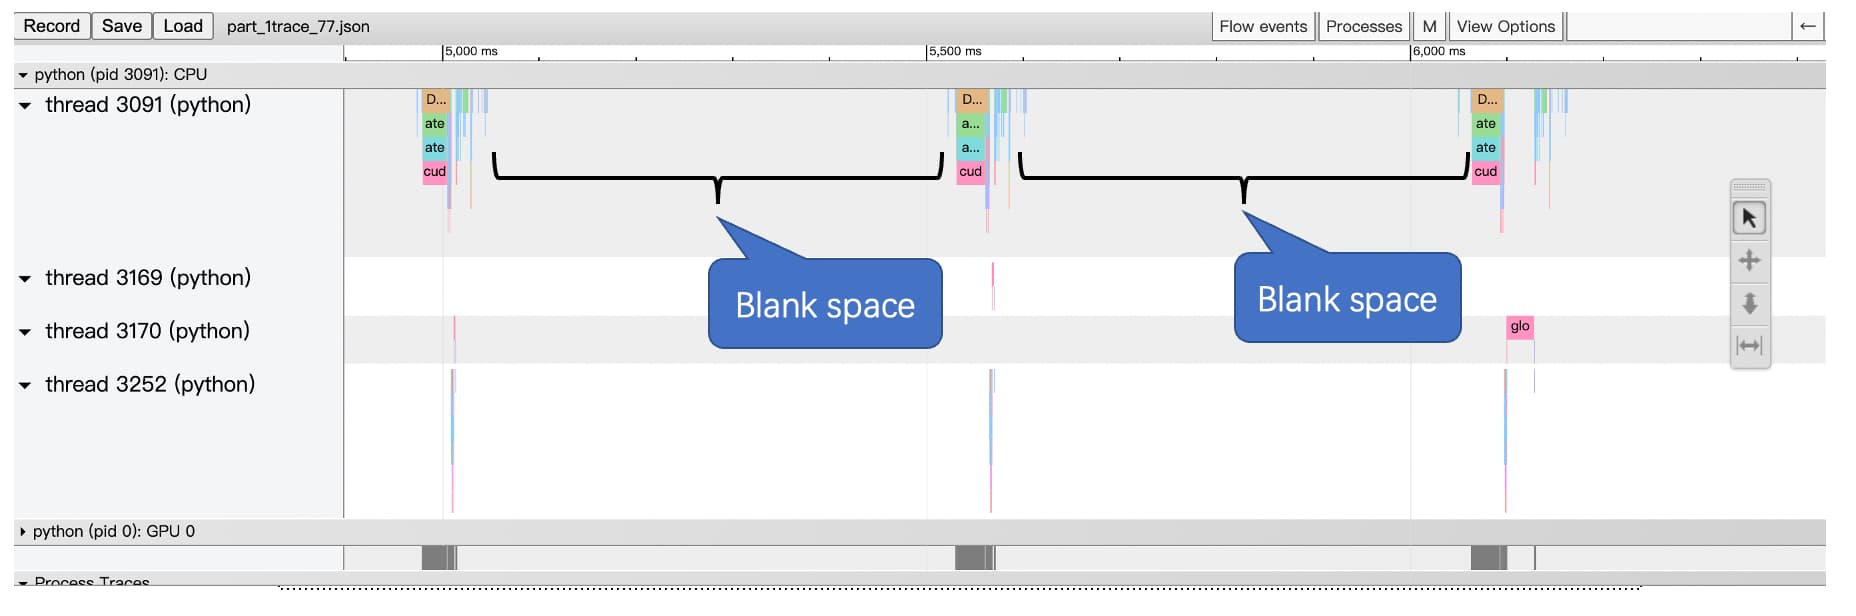
I wonder what those blank spaces between each iteration mean. Is it a normal behaviour or something can be wrong inside my implementation?
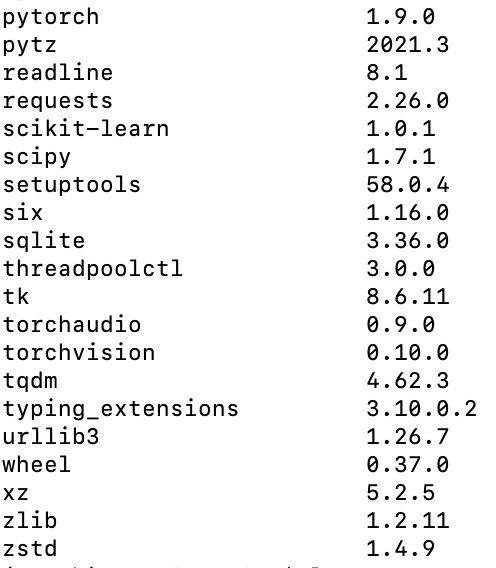
I am using pytorch in it’s GPU-version in an own conda environment and the communication backend is ‘gloo’. There are two machines in the cluster and each machine has an RTX3080. Here the packages that are installed in my conda environment:


Can anybody help me with this?

Thank you in advance,
Yaqi

The link you pasted is not for distributed training. do you mean this one: dgl/examples/pytorch/graphsage/experimental at master · dmlc/dgl · GitHub.

Could you obtain the function calls before/after the BLANK?
Are the BLANKs shown in each epoch? after each iteration?
Have you tried with non-distributed training?

Sorry for my wrong description.
Yes I use

for distributed training.
Well, the BLANKs shown in each epoch after each iteration.
When I try non-distributed training, there is no such phenomenon between each iteration.

according to your screenshot, the BLANK is the major time-consuming part within an epoch? this seems weird. how much the exact ratio is? During the BLANK, is there any thread busy on something or all threads are idle?

as for the each epoch after each iteration, do you mean Line_A or Line_B?

for e in range(num_epochs):
   # each epoch
   for step, blocks in enumerate(dataloader):
       # each iteration
       model(...)
       ...
       optimizer.step()
       # BLANK ???  Line_A
   # BLANK ???     Line_B

Yes, the BLANK area takes up 82% of the time of an iteration (in my profiler BLANK consumes 465ms while others are about 101ms). When I checked the launch.py file, I found that it would give each machine in the cluster a server-side command and a client-side command. The client command calls the DDP API of pytorch. So I guess if the server-side command is dgl distributed graph sampling. Because of there is no dataloader part in my profiler file, so is the sampling operation of the running graph on the server side and my profiler only records the part of the client DDP? In other words, this BLANK part should be the dataloader?

Yes, your guess makes sense.

Sampling could happen locally or remotely, namely on clients or servers. Have you profiled all client processes? Here’s the total number of clients: tot_num_clients = args.num_trainers * (1 + args.num_samplers) * len(hosts).

And such BLANK may be expected in the beginning of each EPOCH as we need to generate brand new mini batches. But BLANK is not expected in the beginning of each batch ITERATION as we have prefetch/cache logic.

So,

  1. could you try to profile all processes(at least the processes on one machine) including samplers, servers to find out what/who is on-going during the BLANK?
  2. try to change below arguments when calling launch.py: --num_samplers, --num_servers? any difference?

Thanks for your suggestion!
I use the Nsight System to get the training timeline. Here is the screenshot of the profiler:


So I am more convinced that the blank part is that the dataloader reads a minibatch from the graph.
And when I increase num_sampler and num_server, the time of the blank part is reduced, but it can’t keep reducing.
I have one more question. When using METIS to partition the graph into two sub-datasets and put them on two machines, if the neighbor nodes of the target node are on another machine, will this machine access the other side’s sub-dataset?

Great. So BLANK is not really blank…

As for the METIS partition issue, yes. clients will ask servers to pass those data back.

This topic was automatically closed 30 days after the last reply. New replies are no longer allowed.