Hi all,
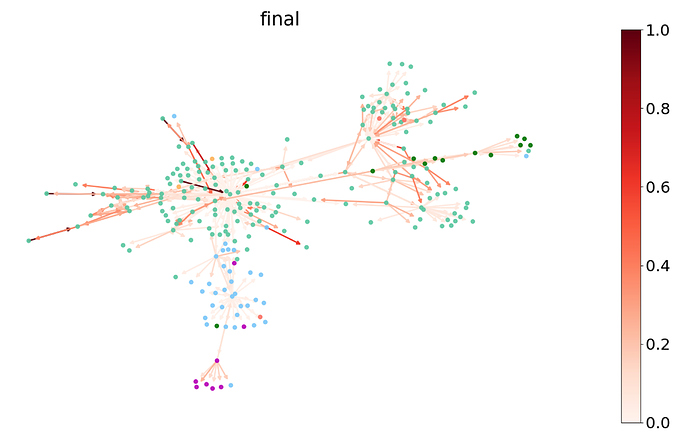
I’m trying to imply the visualise about the GAT in tutorial like this
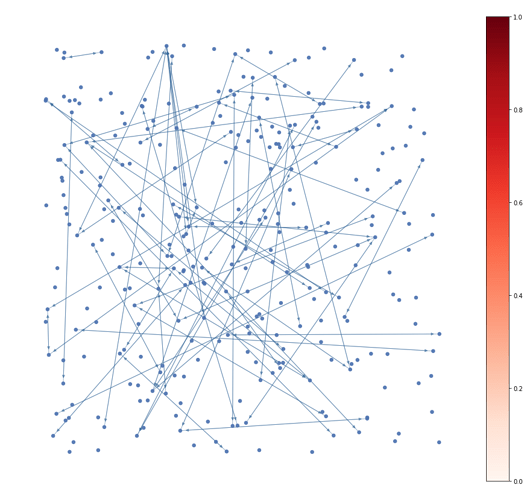
and I find the issue in here
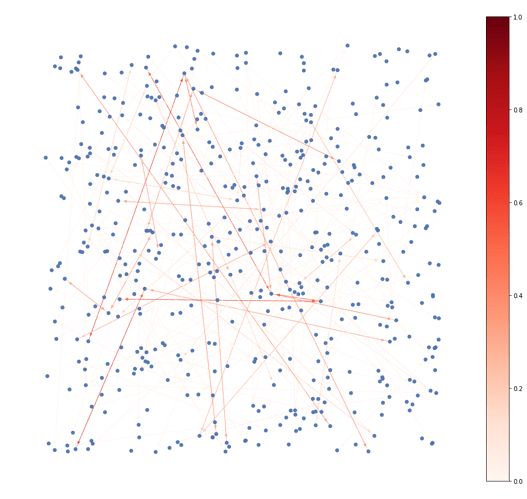
but there is still some problem
import random
import matplotlib.pyplot as plt
import networkx as nx
import seaborn as sns
def plot(g, attention, ax, nodes_to_plot=None, nodes_labels=None,
             edges_to_plot=None, nodes_pos=None, nodes_colors=None,
             edge_colormap=plt.cm.Reds):

    if nodes_to_plot is None:
        nodes_to_plot = sorted(g.nodes())
    if edges_to_plot is None:
        assert isinstance(g, nx.DiGraph), 'Expected g to be an networkx.DiGraph' \
                                          'object, got {}.'.format(type(g))
        edges_to_plot = sorted(g.edges())
#     print(g.edges)

    nx.draw_networkx_edges(g, nodes_pos, edgelist=edges_to_plot,
                           edge_color=attention, edge_cmap=edge_colormap,
                           width=1, alpha=0.5, ax=ax, edge_vmin=0,
                           edge_vmax=1)

    if nodes_colors is None:
        nodes_colors = sns.color_palette("deep", max(nodes_labels) + 1)

    nx.draw_networkx_nodes(g, nodes_pos, nodelist=nodes_to_plot, ax=ax, node_size=30,
                           node_color=[nodes_colors[nodes_labels[v - 1]] for v in nodes_to_plot],
                           with_labels=False, alpha=0.9)

l = random.sample(range(len(g.nodes())), 300)
sub = g.subgraph(l)
sub.copy_from_parent()
attention = sub.edata['e'].detach().numpy()
_max = max(attention)
_min = min(attention)
norm = [(float(i)-_min)/(_max-_min) for i in attention]

fig, ax = plt.subplots(figsize=(15, 15))
plot(g.to_networkx(), attention=sorted(g.edata['e'].detach().numpy()), ax=ax, nodes_pos=nx.random_layout(g.to_networkx()), nodes_labels=[0]*len(g.nodes()))
# plot(sub.to_networkx(), attention=[0.1, 0.2, 1.0], ax=ax, nodes_pos=nx.random_layout(sub.to_networkx()), nodes_labels=[0]*len(sub.nodes()))
ax.set_axis_off()
sm = plt.cm.ScalarMappable(cmap=plt.cm.Reds, norm=plt.Normalize(vmin=0, vmax=1))
sm.set_array([])
plt.colorbar(sm, fraction=0.046, pad=0.01)
plt.show()
I have no idea about why my attention(type numpy list) doesn’t work
It always return “ValueError: RGBA sequence should have length 3 or 4”
From my understanding, the attention is the list of value where representative the edge color,
so the len of attention should as same as number of edges in graph
but it doesn’t work
and if I set attention like [0.2, 0.6, 0.6] it works
can anybody tell me what the problem is and how to solve it?
Thanks a lot!


