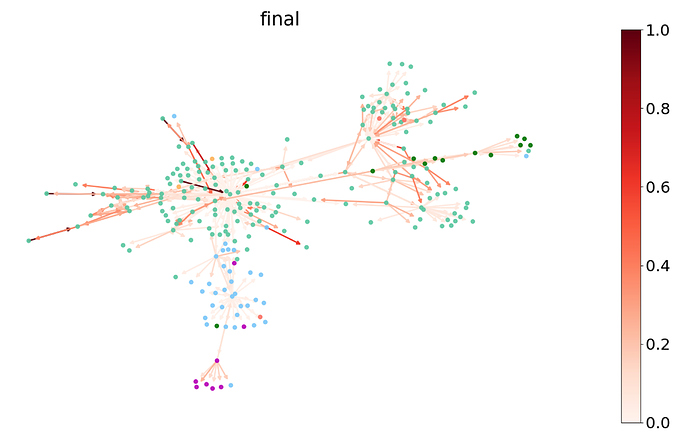
I have been reading the post (https://www.dgl.ai/blog/2019/02/17/gat.html) that introduces the GAT model.
I am really impressed by the figure that visulizes the edges in different clours (see below).
Could anyone provide the code for like this edges visualization?
Any help would be much appreciated.

